Digital
Acoustic
Cartography
Data Source are image-sequences recorded by the ›Acoustic Camera‹ (Microphone arrays with optical camera), developed by GFaI (Gesellschaft zur Förderung angewandter Informatik) in Berlin, Germany. Both, acoustic and photographic images, are analyzed by a specially developed Software in Processing. The color-spectrum of the acoustic images is used as distortion matrix to warp the source image into a threedimensional relief. The color-spectrum is replaced by the photographic data and and allows to read both optical and acoustic information.

Visualization:
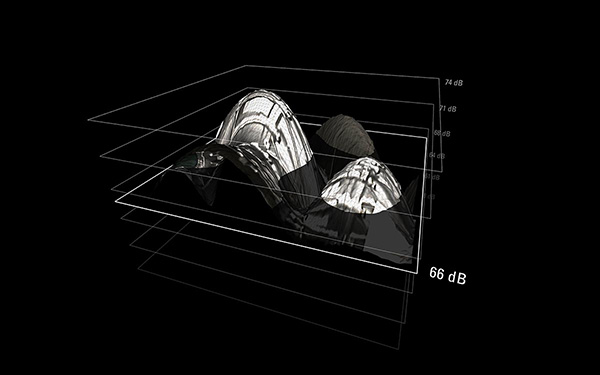
Acoustic Anatomy
›Acoustic Anatomy‹ visualizes the noise-spectrum of different frequencies of automobile gear. The third-octave-bands are clustered between 500 - 5000 Hz in a range of 58 - 74 dB.


Visualization:
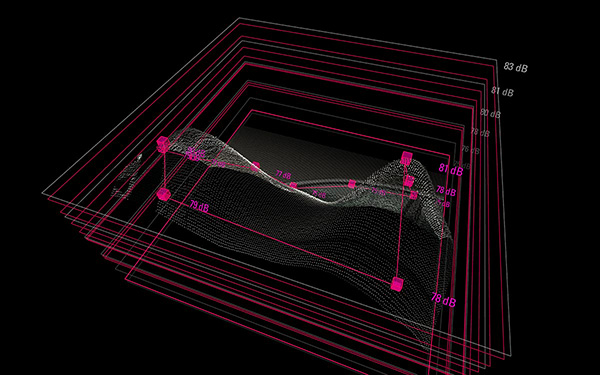
Acoustic Kinetics
The kinetic motion of sound of a automobile door strike in 62 ms. For the visualization, 124 individual images with a total of 11,457,600 image pixels were analyzed, processed and imaged.


Supported by
- Dr. Ing.h.c. F. Porsche AG, Acoustics and vibration technology
- GFaI (Gesellschaft zur Förderung angewandter Informatik), Acoustic Camera
Awards
- iF Communication Design Award, 2005
- Red Dot Award Communication Design, 2005
- Bavarian State Prize for Young Designers, 2006
- Digital Sparks Nominee, 2006
- Design Award Mensch&Computer Conference, 2006
- Media Award Unterfranken, 2005
- Award Wilhelm-Renkhoff-Foundation, 2005
Publications & Exhibitions
- Arndt, Henrik: Integrierte Informationsarchitektur, 2006
- Neues Museum, Nürnberg, 2006
- 18. Coburger Designtage, 2006
- Mixedmedia, Milano, 2005
- Mensch & Computer Conference, Linz, 2005
- www.visualcomplexity.com, 2005
- www.processing.org, 2005
- Forschung für die Praxis - Von Robotern, sicheren Daten und einem Massai Krieger. BR alpha, 2005